Executive Summary
This project advances the prediction of podcast listening time to improve episode ranking, advertising pacing, and content investment decisions. Using machine learning, we reduced the average prediction error from 27.09 minutes to 13.11 minutes, representing a 51.6% improvement with interpretable models built in scikit-learn. Validation R2 reached 76.6%, further supporting the accuracy of the approach.
The analysis included robust data cleaning, careful handling of missing values, and comparison of several models. The Histogram Gradient Boosting model provided the most accurate and efficient results. The Decision Tree model performed closely, while the Random Forest model was less effective under the tested parameters.
Deployment of the Histogram Gradient Boosting model is recommended for the initial rollout, with ongoing monitoring of prediction accuracy. Further improvements can be achieved by enriching the feature set and applying cross-validation. This approach delivers measurable business impact, operational simplicity, and a clear foundation for future enhancements.
Introduction
Accurately predicting how long users will listen to podcast episodes is essential for streaming and audio platforms aiming to optimise content recommendations, allocate advertising inventory effectively, and guide content investment decisions. Listening time serves as a direct indicator of user engagement and has a measurable impact on monetisation opportunities.
The training data contains 750,000 rows and is a synthetic derivative of the original podcast listening time dataset. This ensures a robust foundation for model development while allowing for meaningful comparisons and validation.
This capstone project set out to develop a transparent and reproducible machine learning pipeline that delivers meaningful improvements over a simple average-based prediction. The focus was on using interpretable models available in scikit-learn, ensuring that the solution remains accessible, explainable, and aligned with best practices.
Methodology
Data Source: The dataset for this project was sourced from the Kaggle Playground Series competition “Predict Podcast Listening Time.” The data consists of synthetic derivatives of original podcast engagement records, designed to closely resemble real world listening patterns while ensuring privacy and fairness in model evaluation.
| id | Podcast_Name | Episode_Title | Episode_Length_minutes | Genre | Host_Popularity_percentage | Publication_Day | Publication_Time | Guest_Popularity_percentage | Number_of_Ads | Episode_Sentiment | Listening_Time_minutes |
|---|---|---|---|---|---|---|---|---|---|---|---|
| 0 | Mystery Matters | Episode 98 | NaN | True Crime | 74.81 | Thursday | Night | NaN | 0.0 | Positive | 31.41998 |
| 1 | Joke Junction | Episode 26 | 119.80 | Comedy | 66.95 | Saturday | Afternoon | 75.95 | 2.0 | Negative | 88.01241 |
| 2 | Study Sessions | Episode 16 | 73.90 | Education | 69.97 | Tuesday | Evening | 8.97 | 0.0 | Negative | 44.92531 |
| 3 | Digital Digest | Episode 45 | 67.17 | Technology | 57.22 | Monday | Morning | 78.70 | 2.0 | Positive | 46.27824 |
| 4 | Mind & Body | Episode 86 | 110.51 | Health | 80.07 | Monday | Afternoon | 58.68 | 3.0 | Neutral | 75.61031 |
| id | Podcast_Name | Episode_Title | Episode_Length_minutes | Genre | Host_Popularity_percentage | Publication_Day | Publication_Time | Guest_Popularity_percentage | Number_of_Ads | Episode_Sentiment |
|---|---|---|---|---|---|---|---|---|---|---|
| 750000 | Educational Nuggets | Episode 73 | 78.96 | Education | 38.11 | Saturday | Evening | 53.33 | 1.0 | Neutral |
| 750001 | Sound Waves | Episode 23 | 27.87 | Music | 71.29 | Sunday | Morning | NaN | 0.0 | Neutral |
| 750002 | Joke Junction | Episode 11 | 69.10 | Comedy | 67.89 | Friday | Evening | 97.51 | 0.0 | Positive |
| 750003 | Comedy Corner | Episode 73 | 115.39 | Comedy | 23.40 | Sunday | Morning | 51.75 | 2.0 | Positive |
| 750004 | Life Lessons | Episode 50 | 72.32 | Lifestyle | 58.10 | Wednesday | Morning | 11.30 | 2.0 | Neutral |
Three files were provided: a training set with the target variable Listening_Time_minutes, a test set without the target, and a sample submission template. The training data contains 750,000 rows and includes episode details, popularity metrics, genre, publication timing, sentiment and advertisement counts. The test set contains 250,000 rows but without the target variable. Only the training set was used for model selection, with the test set reserved for final inference and submission.
Target & Metric: The target variable for prediction is Listening_Time_minutes which measures how long a user listens to a podcast episode. Model performance was evaluated using Root Mean Squared Error (RMSE), a metric that quantifies the average prediction error in minutes and penalises larger mistakes more heavily. The baseline for comparison was the mean listening time from the training set.
Modelling Approach: The modelling process advanced in clear, purposeful steps from simple to more sophisticated methods, each chosen for interpretability and efficiency. This staged approach ensured that extra complexity was only introduced when it provided a measurable reduction in error and a clear business benefit:
- Baseline Mean Predictor: Served as the control, highlighting the error from a basic approach and setting a clear benchmark for improvement.
- Decision Tree: Enabled splits on important feature thresholds such as episode length or popularity. Each split represents a straightforward decision rule, making the model easy to interpret.
- Random Forest: Combined many shallow trees to reduce random noise and produce more stable predictions. This approach improved consistency while keeping runtime manageable.
- Histogram Gradient Boosting: Built trees sequentially, each one focusing on correcting the errors of the previous. This method achieved strong accuracy quickly, handled mixed feature types well, and remained efficient for deployment.
Exploratory Data Analysis
Preprocessing: The raw training file contained a mix of numbers such as counts and durations and categories such as genre, publication day and sentiment labels. We removed the identifier column since it does not help prediction, filled missing numeric values with the middle value of the distribution, and filled missing categorical values with the most common entry so that no rows were lost. Categorical fields were converted into model friendly indicator columns while keeping the structure consistent between training and validation splits. Because all models were tree based we did not need to standardise or scale values which keeps the pipeline simpler and faster to run.
Exploratory Analysis:
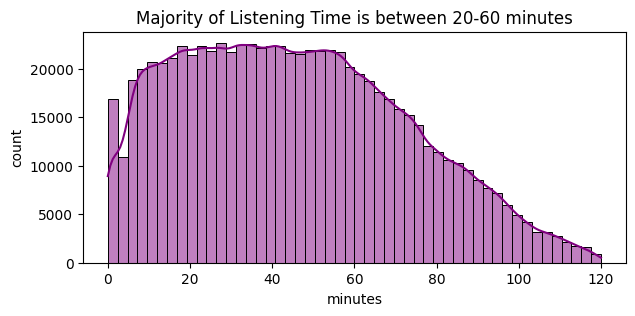
Listening Time Distribution: We reviewed basic distributions to check for extreme outliers, compared average listening time across key categories such as genre, publication day and sentiment, and inspected simple relationships for the most influential numeric fields.
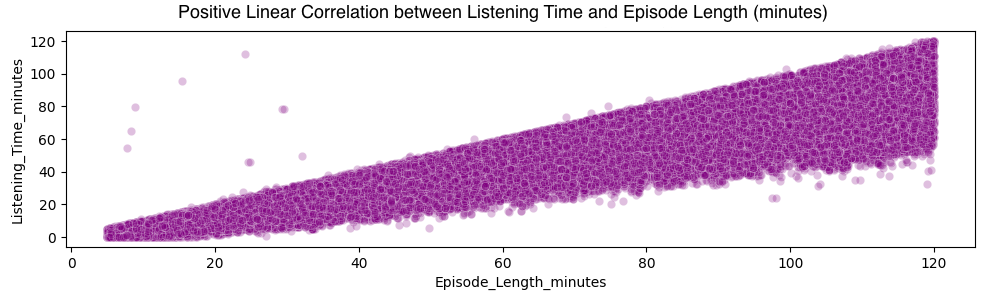
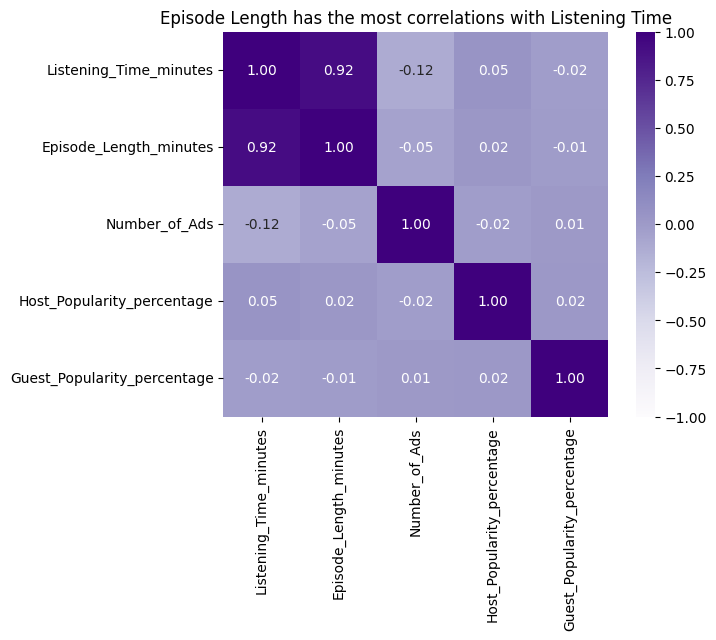
Feature Collinearity: We inspected simple relationships for the most influential numeric fields.
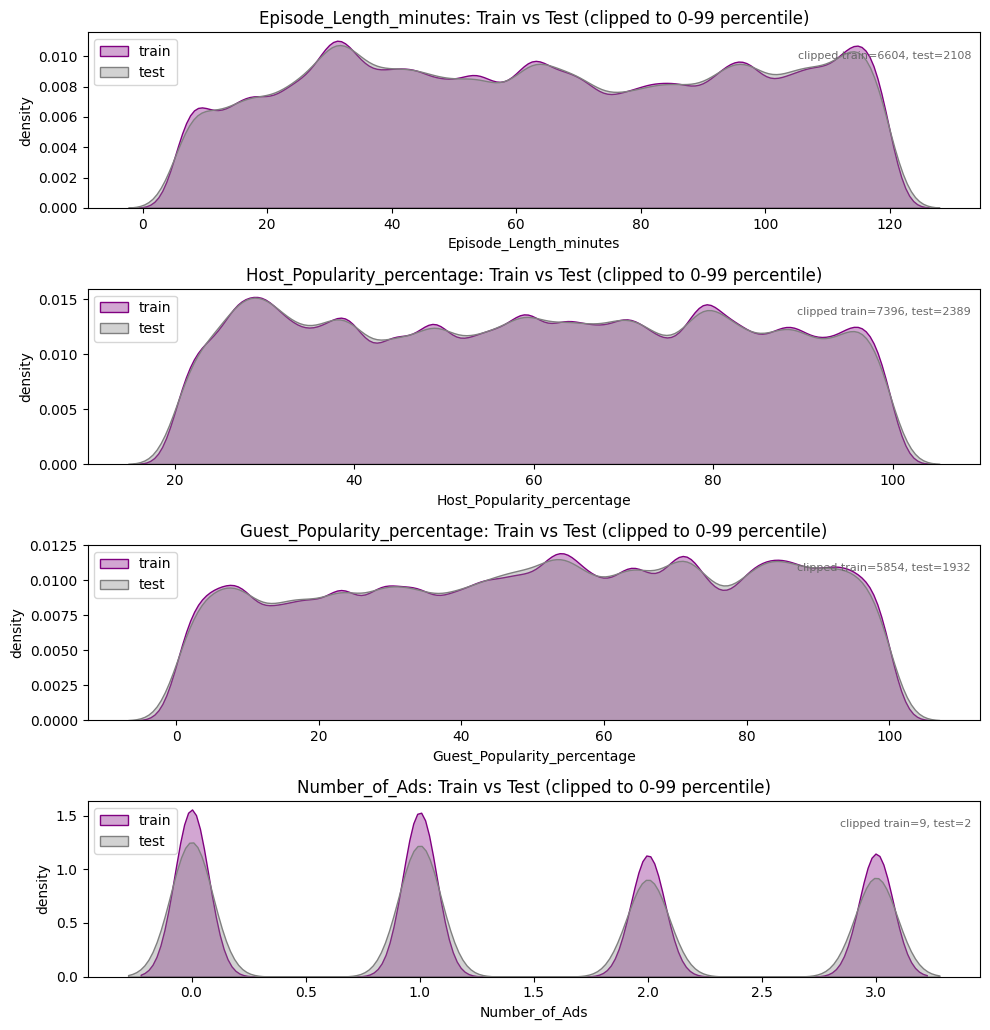
Train vs Test Dataset Comparison: We also overlaid training and test distributions to confirm they were broadly aligned, reducing the risk that the model would face a very different pattern at prediction time. No material shifts or data quality concerns emerged so we proceeded without heavy feature pruning.
Training the Models
Baseline: A simple mean predictor, that always forecasts the average listening time, established an anchor error of 27.09 minutes RMSE. All subsequent models are judged against this reference both in absolute minutes reduced and percentage improvement.
Decision Tree: A single depth controlled tree captured key non linear thresholds such as episode length and popularity splits and reduced RMSE to 13.20 minutes, a drop of 13.89 minutes or 51.3% versus the baseline. This large first step showed that most reducible variance could be explained with a small set of hierarchical rules.
Random Forest: An ensemble of shallow trees produced an RMSE of 16.65 minutes. This is still 10.44 minutes or 38.6% better than the baseline, but 3.45 minutes worse than the single Decision Tree which achieved 13.20. Conservative runtime focused parameters smoothed important sharp splits and weakened accuracy relative to the best tree.
Histogram Gradient Boosting: Sequential boosting refined residual errors and achieved the best RMSE at 13.11 minutes, 13.98 minutes or 51.6% lower than baseline, edging the Decision Tree by 0.09 minutes and outperforming the Random Forest by 3.54 minutes. The marginal gain over the tree indicates diminishing returns yet confirms that targeted residual correction adds a small further improvement without material complexity overhead.
Model Comparison (Validation RMSE):
| Model | RMSE (min) | Δ vs Baseline | % Improvement |
|---|---|---|---|
| Baseline mean | 27.09 | - | - |
| Decision Tree | 13.20 | -13.89 | 51.3% |
| Random Forest | 16.65 | -10.44 | 38.6% |
| HistGradientBoosting | 13.11 | -13.98 | 51.6% |
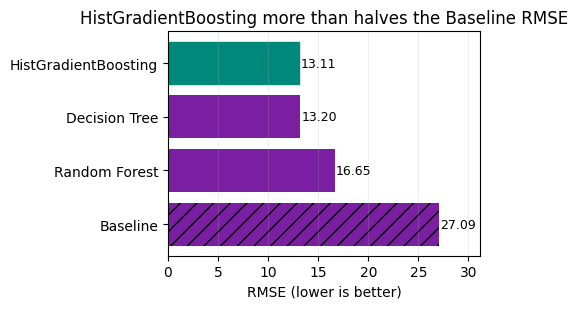
Interpretation: Both the Decision Tree and Histogram Gradient Boosting halved the baseline error. HistGB narrowly led with an advantage of about 0.09 minutes, suggesting most reducible variance was captured by depth controlled tree structure rather than extensive ensembling. The Random Forest underperformed relative to expectations, likely due to conservative depth and leaf constraints chosen for runtime reasons.
Generating Test Predictions
Following model validation, the Histogram Gradient Boosting approach was selected for its combination of accuracy and efficient processing. To maximise predictive power, the model was retrained using the entire labelled dataset, ensuring that all available patterns were captured before generating final predictions.
This fully trained model was then applied to the separate test set of 250,000 episodes, producing individual listening time estimates for each row. These predictions were compiled into the required submission format, including the unique identifier and the predicted listening time in minutes.
By automating this final step and avoiding manual adjustments, the process remains fully reproducible and transparent. The resulting predictions are ready for direct use in episode ranking, advertising pacing, and further business evaluation. Future improvements will build upon this established baseline, supporting ongoing optimisation.
| id | Listening_Time_minutes |
|---|---|
| 750000 | 56.10 |
| 750001 | 18.00 |
| 750002 | 49.26 |
| 750003 | 79.93 |
| 750004 | 48.86 |
Conclusion
This project successfully delivered a transparent and reproducible machine learning pipeline that substantially improved the accuracy of podcast listening time predictions. By reducing the average error from 27.09 minutes to 13.11 minutes, the solution demonstrates clear value for optimising episode ranking, advertising strategies, and content investment decisions.
The recommended Histogram Gradient Boosting model offers a strong balance between predictive accuracy and operational simplicity, making it well-suited for deployment in a production environment. Its performance, coupled with efficient training requirements, ensures the approach remains practical and scalable.
Key drivers of predictive power were episode length, popularity measures, and a subset of sentiment and genre indicators. Moderate correlation among numeric features did not inflate variance, evidenced by the narrow gap between the single tree and boosted model errors which indicates minimal overfitting under the chosen constraints.
Looking ahead, further gains can be realised by implementing k-fold cross-validation for more robust performance reporting, exploring targeted feature engineering, and monitoring for prediction drift post-deployment. These steps will help maintain accuracy and adapt the model as new data becomes available.
Overall, the project achieves its objectives of clarity and measurable improvement, providing a solid foundation for ongoing experimentation and future enhancements.